This website was constructed as a class project for Genetics 564, an undergraduate Genetics course at UW-Madison.
Aldolase B Protein Phylogeny
A phylogenetic tree is a diagram that illustrates the projected evolutionary relationships between species with respect to a genome, gene, or protein [1]. Each node represents a common ancestor between species. There are several online programs that can be used to generate phylogenetic trees by comparing genetic or protein sequences to one another. Each of the trees below was created using Clustal Omega, MUSCLE, and TCoffee, respectively. Each system uses a different method for analyzing given sequences, which can sometimes result in different phylogenetic trees even with the same information. This is seen when comparing the Clustal Omega and MUSCLE trees to the TCoffee tree, which lists the mouse as being more closely related to the invertebrate models and the zebrafish than the human or chimpanzee. Additionally, this tree does not list humans and chimpanzees as closely related as in the other two trees. Despite these differences, it is important to remember that the protein sequences are all still relatively similar between the species. Phylogenetic trees can be used for selection of model organisms in research, and determining the function and evolution of a protein.

Clustal Omega
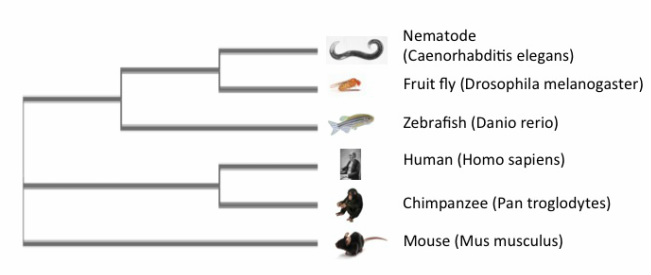
MUSCLE
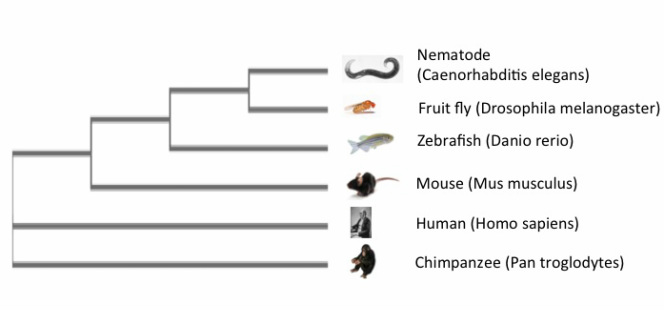
TCoffee
Links to references sequences used to generate phylogenetic trees are on the Protein Homology page.
References
1. Brown TA. Genomes. 2nd edition. Oxford: Wiley-Liss; 2002. Chapter 16, Molecular Phylogenetics. Available from: http://www.ncbi.nlm.nih.gov/books/NBK21122/
Diagrams created by Maddy Ford in Clustal Omega, MUSCLE, and TCoffee
Diagrams created by Maddy Ford in Clustal Omega, MUSCLE, and TCoffee
